E-mini S&P 500 (ES) analysis
Latest read: 2026-07-27 · updated every session · Last updated: July 2026
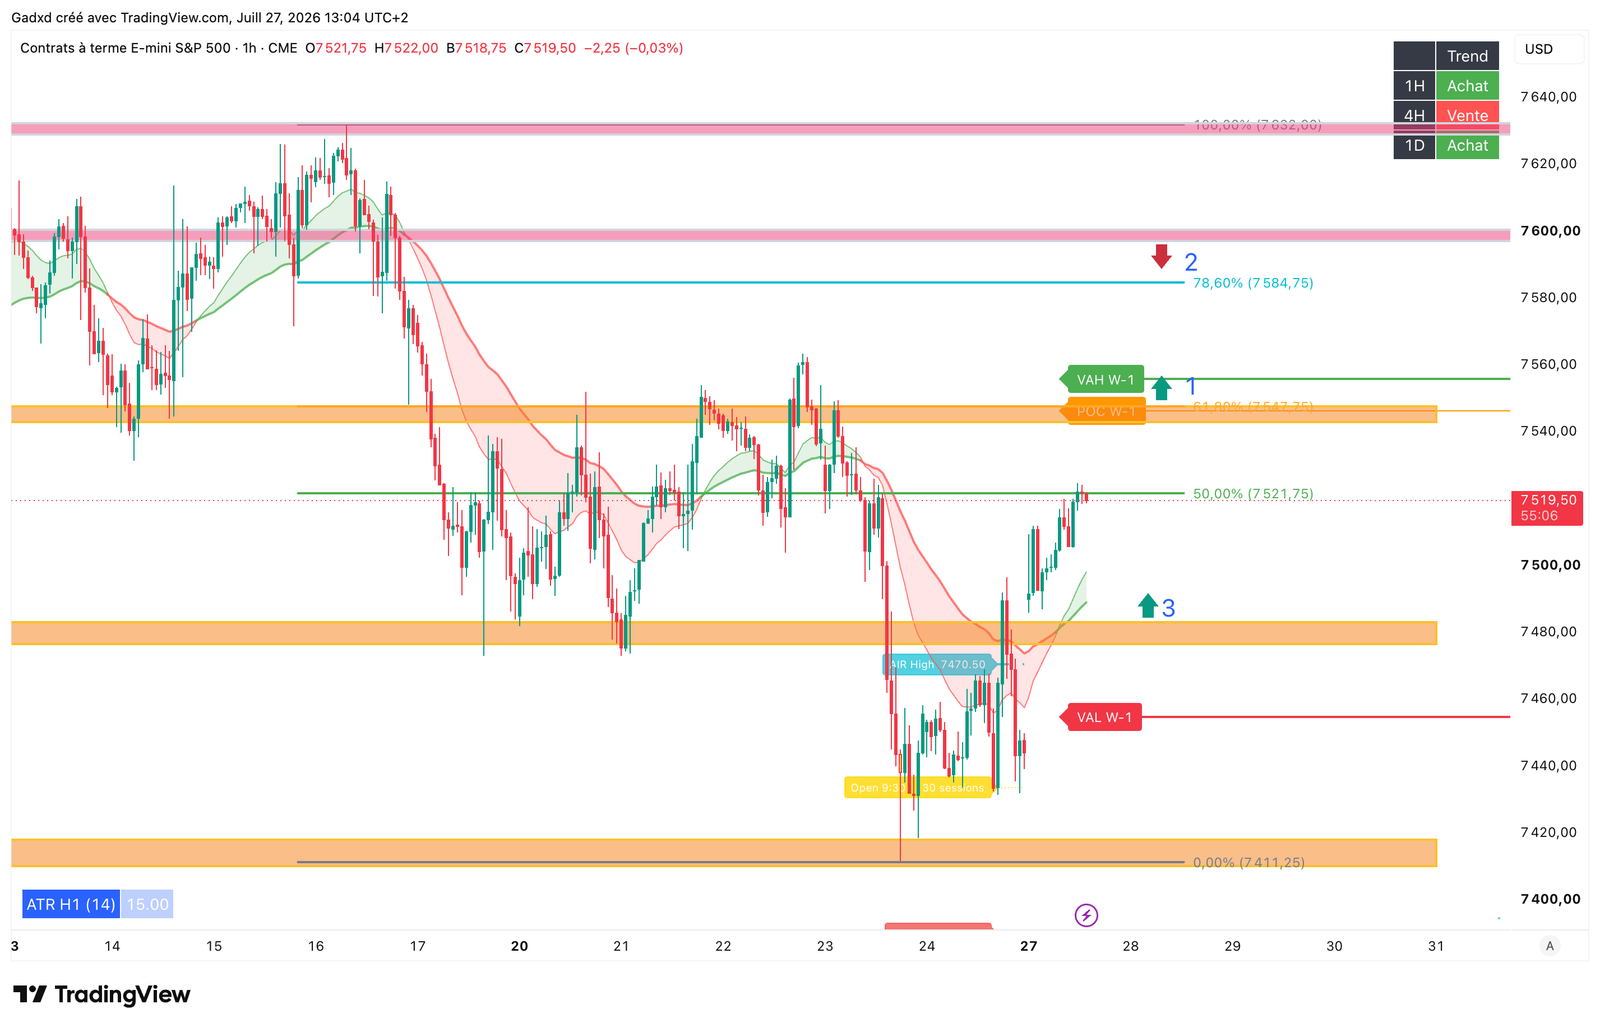
The E-mini S&P 500 (ES) is a CME index future tracking the S&P 500 index of US large-cap stocks, sized at $50 per index point with a 0.25-point tick worth $12.50. For daily trading it is analysed mainly during the US cash session (9:30 a.m.–4:00 p.m. ET), where volume and volatility peak. Educational analysis only. As of 2026-07-27, our multi-timeframe read is bullish (1H/1D), 4H sell. The full plan — key levels, an educational setup and its invalidation zone — is posted free on Telegram at @dindoutrading every session.
ES — latest analysis (2026-07-27)
🔒 Full ES plan — free on Telegram
Key levels, an educational setup and its invalidation zone are posted every session to our channel — free, before the open. Chart and bias above are the preview.
Unlock on Telegram — @dindoutrading →Educational only — not financial advice, not a signal.
How we analyse ES
Our educational analysis maps the session volume profile to locate the point of control (POC), value area high (VAH) and value area low (VAL) as reference levels. We use the average range to frame realistic session targets, watch for liquidity sweeps above prior highs or below prior lows, and set a multi-timeframe bias by aligning the 1H, 4H and 1D structure. This is educational analysis only, not a signal.
What moves ES
- Federal Reserve policy — Rate decisions and forward guidance reprice equity valuations broadly, moving ES across the whole index.
- US macro releases (CPI, non-farm payrolls) — Inflation and jobs surprises shift rate expectations and often trigger the day's largest ES swings around 8:30 a.m. ET.
- S&P 500 earnings seasons — Aggregate constituent results and guidance drive index-level revaluation during quarterly reporting windows.
- Broad risk sentiment — Global risk-on or risk-off flows push ES as the benchmark proxy for US large-cap exposure.
- Index-level flows — Rebalancing and options expiry (OPEX) concentrate flow and can widen intraday range near the close.
It offers deep, continuously quoted, centrally cleared exposure to the broad US large-cap market in a single contract. See full ES contract specs & where to trade.
ES trading sessions
ES trades nearly around the clock on CME Globex, Sunday 6:00 p.m. to Friday 5:00 p.m. ET, with a daily maintenance break from 5:00 to 6:00 p.m. ET. The most active window is the US regular trading hours (RTH), 9:30 a.m. to 4:00 p.m. ET. Liquidity concentrates sharply around the 9:30 a.m. ET equity open.
Typical daily range
Average range, often called the average intraday range (AIR), is the mean high-to-low distance of a session and serves as a realistic target for how far price may travel in a day. On ES it is measured in index points and should be recalculated from recent sessions rather than assumed, because volatility shifts across regimes.
Markets correlated with ES
ES, NQ and YM tend to move together as risk-on/risk-off US index proxies, so intraday direction is usually shared even when magnitude differs. ES typically shows a narrower range than NQ and a broader, more diversified base than the 30-stock YM.
Previous ES sessions
2026-07-24
Today's AIR window ≈ 7410.50–7493.50 → targets inside this band are credible; the 61.8% (7545.50) and weekly value above sit outside = ambitious for one session. ATR(1H) ≈ 15 pts (tight) — size accordingly. Broad risk-off day: US indices are deep below weekly value while gold and BTC have also lost their daily buy. Educational only — react at levels, wait for the reclaim, don't anticipate.
2026-07-23
Today's AIR window ≈ 7506–7587 → targets inside this band are credible; VAH W-1 (7620) sits outside = ambitious. ATR(1H) ≈ 15 pts (tight) — size accordingly. React at levels, wait for the reclaim — don't anticipate.
Get the full ES plan, free — every session
Key levels, an educational setup and its invalidation zone on ES and 6 other markets, before the open.
Join @dindoutrading →ES analysis — FAQ
› Is ES bullish or bearish today?
As of 2026-07-27, our read on E-mini S&P 500 (ES) is: bullish (1H/1D), 4H sell. We map the levels where price has historically reacted rather than predicting direction — the full multi-timeframe bias and plan are posted free on Telegram each session.
› What are ES futures trading hours?
ES futures trade on CME Globex from Sunday 6:00 p.m. to Friday 5:00 p.m. ET, with a daily maintenance break from 5:00 to 6:00 p.m. ET. The most active period is the US regular session, 9:30 a.m. to 4:00 p.m. ET, when volume and volatility are highest.
› How much is one ES tick worth?
One ES tick is 0.25 index points and is worth $12.50 per contract, because the E-mini S&P 500 is sized at $50 per index point. A full one-point move therefore equals $50. The Micro E-mini (MES) is one-tenth the size, at $1.25 per tick.
› What moves S&P 500 (ES) futures intraday?
ES is driven intraday by Federal Reserve expectations, US macro releases such as CPI and non-farm payrolls, S&P 500 earnings, and broad risk sentiment. Scheduled 8:30 a.m. ET data and the 9:30 a.m. ET equity open typically produce the sharpest moves of the session.
› ES vs NQ: which is better for day trading?
ES tracks the broad S&P 500 and usually moves in a narrower range, while NQ tracks the tech-heavy Nasdaq-100 and typically shows a wider daily range and larger swings. Neither is objectively better; ES suits traders wanting steadier, more diversified index exposure. This is educational information, not advice.
› What is a realistic daily target on ES futures?
A realistic ES day target is usually framed against the average intraday range (AIR), the mean high-to-low distance of recent sessions, rather than a fixed point figure. Because volatility changes with the regime, the value should be recalculated from recent data, not assumed from a single number.
› What is the difference between ES and MES?
ES is the standard E-mini S&P 500 at $50 per index point, worth $12.50 per 0.25-point tick. MES is the Micro E-mini, one-tenth the size at $5 per index point and $1.25 per tick. Both track the same S&P 500 index and trade on the same CME Globex hours.
› How do you read a volume profile on ES?
A volume profile on ES shows how much volume traded at each price, highlighting the point of control (POC, the most-traded price) and the value area high and low (VAH/VAL). Analysts use these as reference levels where price often reacts. This is educational analysis only.
› Where can I get free ES analysis?
Free daily E-mini S&P 500 analysis — bias, key levels and one educational setup — is published every session on Telegram at @dindoutrading. This page mirrors the latest read; the full plan is on the channel.
› Does Dindou Trading give ES signals?
No. Everything is educational analysis of price structure — we never tell anyone what to buy or sell, and there is no paid signal service.