E-mini Nasdaq-100 (NQ) analysis
Latest read: 2026-07-27 · updated every session · Last updated: July 2026
The E-mini Nasdaq-100 (NQ) is a CME index future tracking the Nasdaq-100 of large non-financial Nasdaq-listed companies, sized at $20 per index point with a 0.25-point tick worth $5.00. It is analysed mainly during the US cash session (9:30 a.m.–4:00 p.m. ET) and typically shows a wider daily range than the S&P 500. Educational analysis only. As of 2026-07-27, our multi-timeframe read is bearish (1H/4H), 1D buy. The full plan — key levels, an educational setup and its invalidation zone — is posted free on Telegram at @dindoutrading every session.
NQ — latest analysis (2026-07-27)
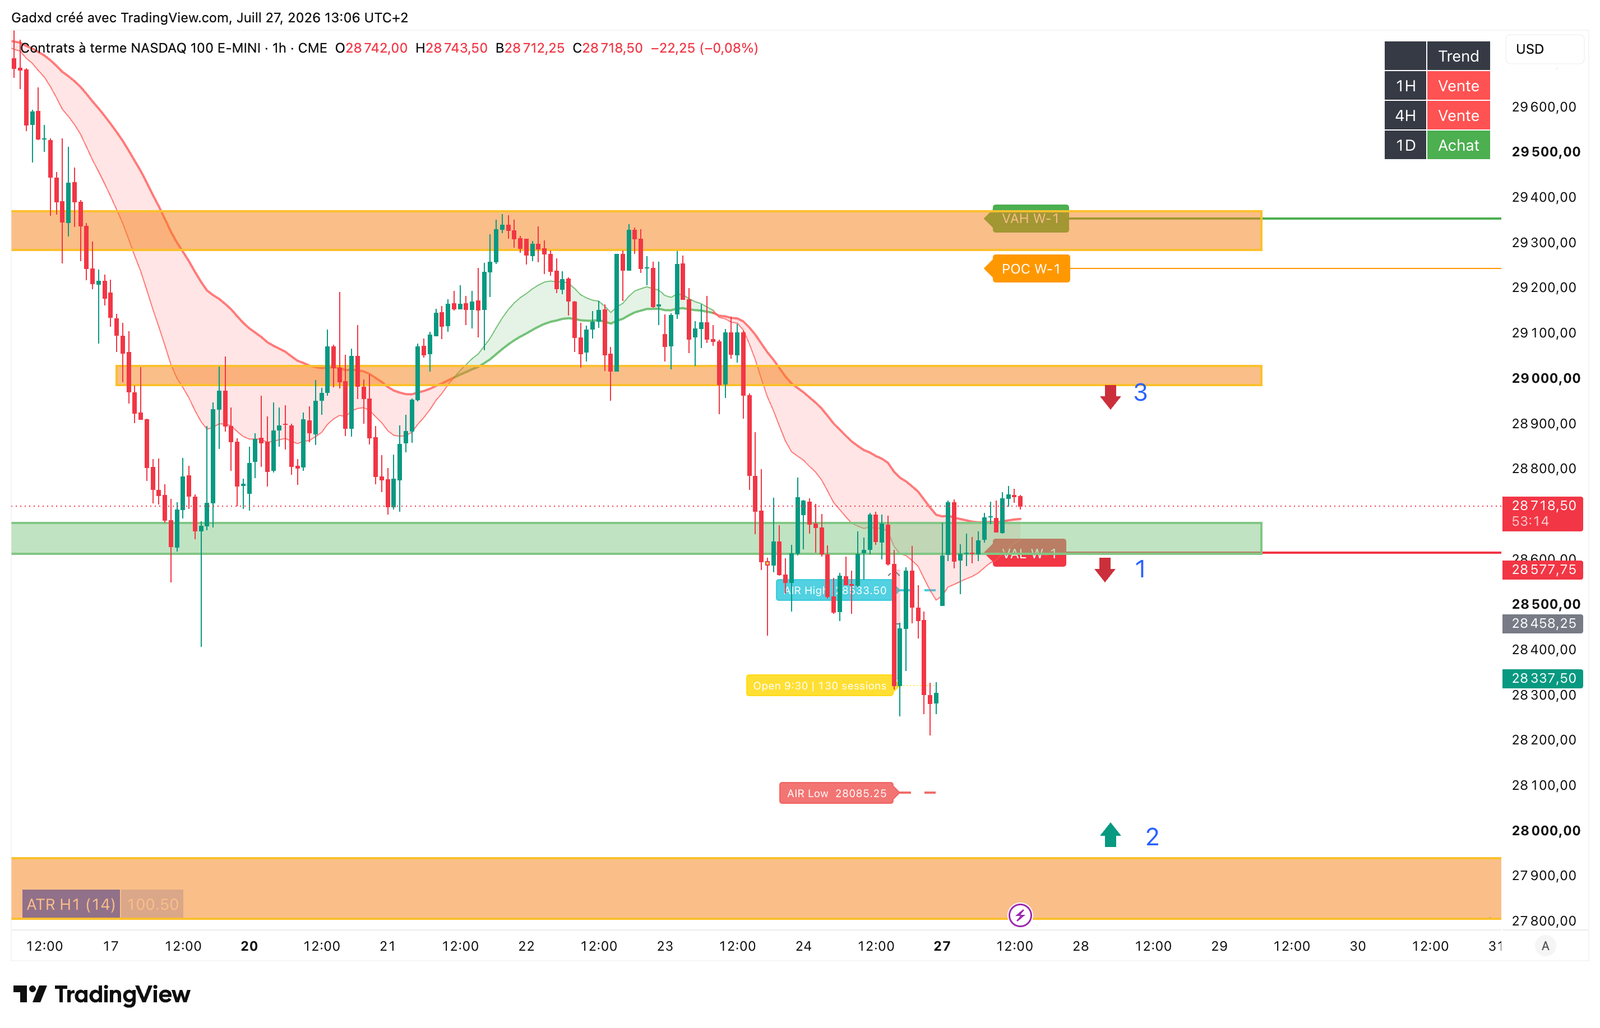
🔒 Full NQ plan — free on Telegram
Key levels, an educational setup and its invalidation zone are posted every session to our channel — free, before the open. Chart and bias above are the preview.
Unlock on Telegram — @dindoutrading →Educational only — not financial advice, not a signal.
How we analyse NQ
We map the session volume profile to mark the point of control (POC) and value area high and low (VAH/VAL) as reaction levels. The average range frames realistic NQ targets, we track liquidity sweeps beyond prior session highs and lows, and we align a multi-timeframe bias across the 1H, 4H and 1D charts. This is educational analysis only, not a trade signal.
What moves NQ
- Mega-cap tech earnings — Results from Apple, Microsoft, Nvidia and peers move NQ heavily given their large index weight.
- US interest-rate expectations — Rate shifts hit long-duration growth valuations hardest, amplifying NQ moves versus broader indices.
- Semiconductor and AI capex news — Chip demand and AI investment headlines drive the technology bloc that dominates the Nasdaq-100.
- US CPI and inflation data — Inflation surprises reprice growth stocks quickly, often producing NQ's sharpest intraday swings.
- Broad risk sentiment — As a high-beta index, NQ tends to lead risk-on rallies and risk-off selloffs relative to ES and YM.
It concentrates exposure to US technology and growth mega-caps, and typically shows a wider daily range than the S&P 500 contract. See full NQ contract specs & where to trade.
NQ trading sessions
NQ trades on CME Globex from Sunday 6:00 p.m. to Friday 5:00 p.m. ET, with a daily 5:00–6:00 p.m. ET maintenance break. Its most active session is the US regular trading hours (RTH), 9:30 a.m. to 4:00 p.m. ET. Tech-heavy flows make the open and macro releases especially volatile for NQ.
Typical daily range
Average range (AIR) is the mean high-to-low distance of a session and is used as a realistic intraday target. NQ generally posts a wider point range than ES because it concentrates high-beta technology mega-caps; the exact figure is measured in index points and must be recalculated from recent sessions rather than assumed.
Markets correlated with NQ
NQ moves closely with ES and YM as a US risk-on/risk-off proxy, usually sharing intraday direction. Because it is tech-concentrated and higher beta, NQ typically amplifies the move, showing a wider range than ES and a much larger range than the blue-chip YM.
Previous NQ sessions
2026-07-24
Today's AIR window ≈ 28461.75–28925.50 → targets inside this band are credible; VAL W-1 and POC W-1 above sit outside = ambitious. ATR(1H) ≈ 107 pts (wide) — size accordingly. NQ mirrors ES: deep below weekly value, holding demand on a broad risk-off day. Educational only — react at levels, don't anticipate.
2026-07-23
Today's AIR window ≈ 29043–29489 → targets inside this band are credible; POC W-1 (29600) sits ABOVE the AIR High = ambitious. ATR(1H) ≈ 99 pts (wide) — size accordingly. React at levels, wait for the reclaim — don't anticipate.
Get the full NQ plan, free — every session
Key levels, an educational setup and its invalidation zone on NQ and 6 other markets, before the open.
Join @dindoutrading →NQ analysis — FAQ
› Is NQ bullish or bearish today?
As of 2026-07-27, our read on E-mini Nasdaq-100 (NQ) is: bearish (1H/4H), 1D buy. We map the levels where price has historically reacted rather than predicting direction — the full multi-timeframe bias and plan are posted free on Telegram each session.
› How volatile is NQ intraday?
NQ is typically the most volatile of the main US index futures because the Nasdaq-100 concentrates high-beta technology mega-caps. It generally posts a wider high-to-low point range than ES and YM. The exact average intraday range shifts with the volatility regime and should be measured from recent sessions.
› What are NQ futures trading hours?
NQ futures trade on CME Globex from Sunday 6:00 p.m. to Friday 5:00 p.m. ET, with a daily maintenance break from 5:00 to 6:00 p.m. ET. The most active period is the US regular session, 9:30 a.m. to 4:00 p.m. ET, when volume and range peak.
› How much is one NQ tick worth?
One NQ tick is 0.25 index points and is worth $5.00 per contract, because the E-mini Nasdaq-100 is sized at $20 per index point. A full one-point move equals $20. The Micro E-mini (MNQ) is one-tenth the size, at $0.50 per tick.
› What moves Nasdaq-100 (NQ) futures?
NQ is driven by mega-cap technology earnings, US interest-rate expectations, semiconductor and AI capital-expenditure news, and CPI inflation data. Because growth valuations are rate-sensitive, NQ often reacts more sharply to rate and inflation surprises than the broader S&P 500 contract.
› Why does NQ move more than ES?
NQ moves more than ES because the Nasdaq-100 is concentrated in high-beta technology and growth mega-caps, whose valuations are more sensitive to interest rates. This higher beta typically produces a wider daily range on NQ than on the more diversified S&P 500 (ES). This is educational information, not advice.
› What is a realistic daily target on NQ futures?
A realistic NQ target is framed against its average intraday range (AIR), the mean high-to-low distance of recent sessions, not a fixed point number. NQ's range is usually wider than ES; because it varies with volatility, recompute it from recent data before relying on any figure.
› NQ vs ES for day trading?
NQ tracks the tech-heavy Nasdaq-100 with a wider, faster daily range, while ES tracks the broader S&P 500 with steadier moves. NQ can offer larger point swings but larger risk per contract. Neither is universally better; the choice depends on risk tolerance. Educational information only.
› Where can I get free NQ analysis?
Free daily E-mini Nasdaq-100 analysis — bias, key levels and one educational setup — is published every session on Telegram at @dindoutrading. This page mirrors the latest read; the full plan is on the channel.
› Does Dindou Trading give NQ signals?
No. Everything is educational analysis of price structure — we never tell anyone what to buy or sell, and there is no paid signal service.